Hospital for Special Surgery
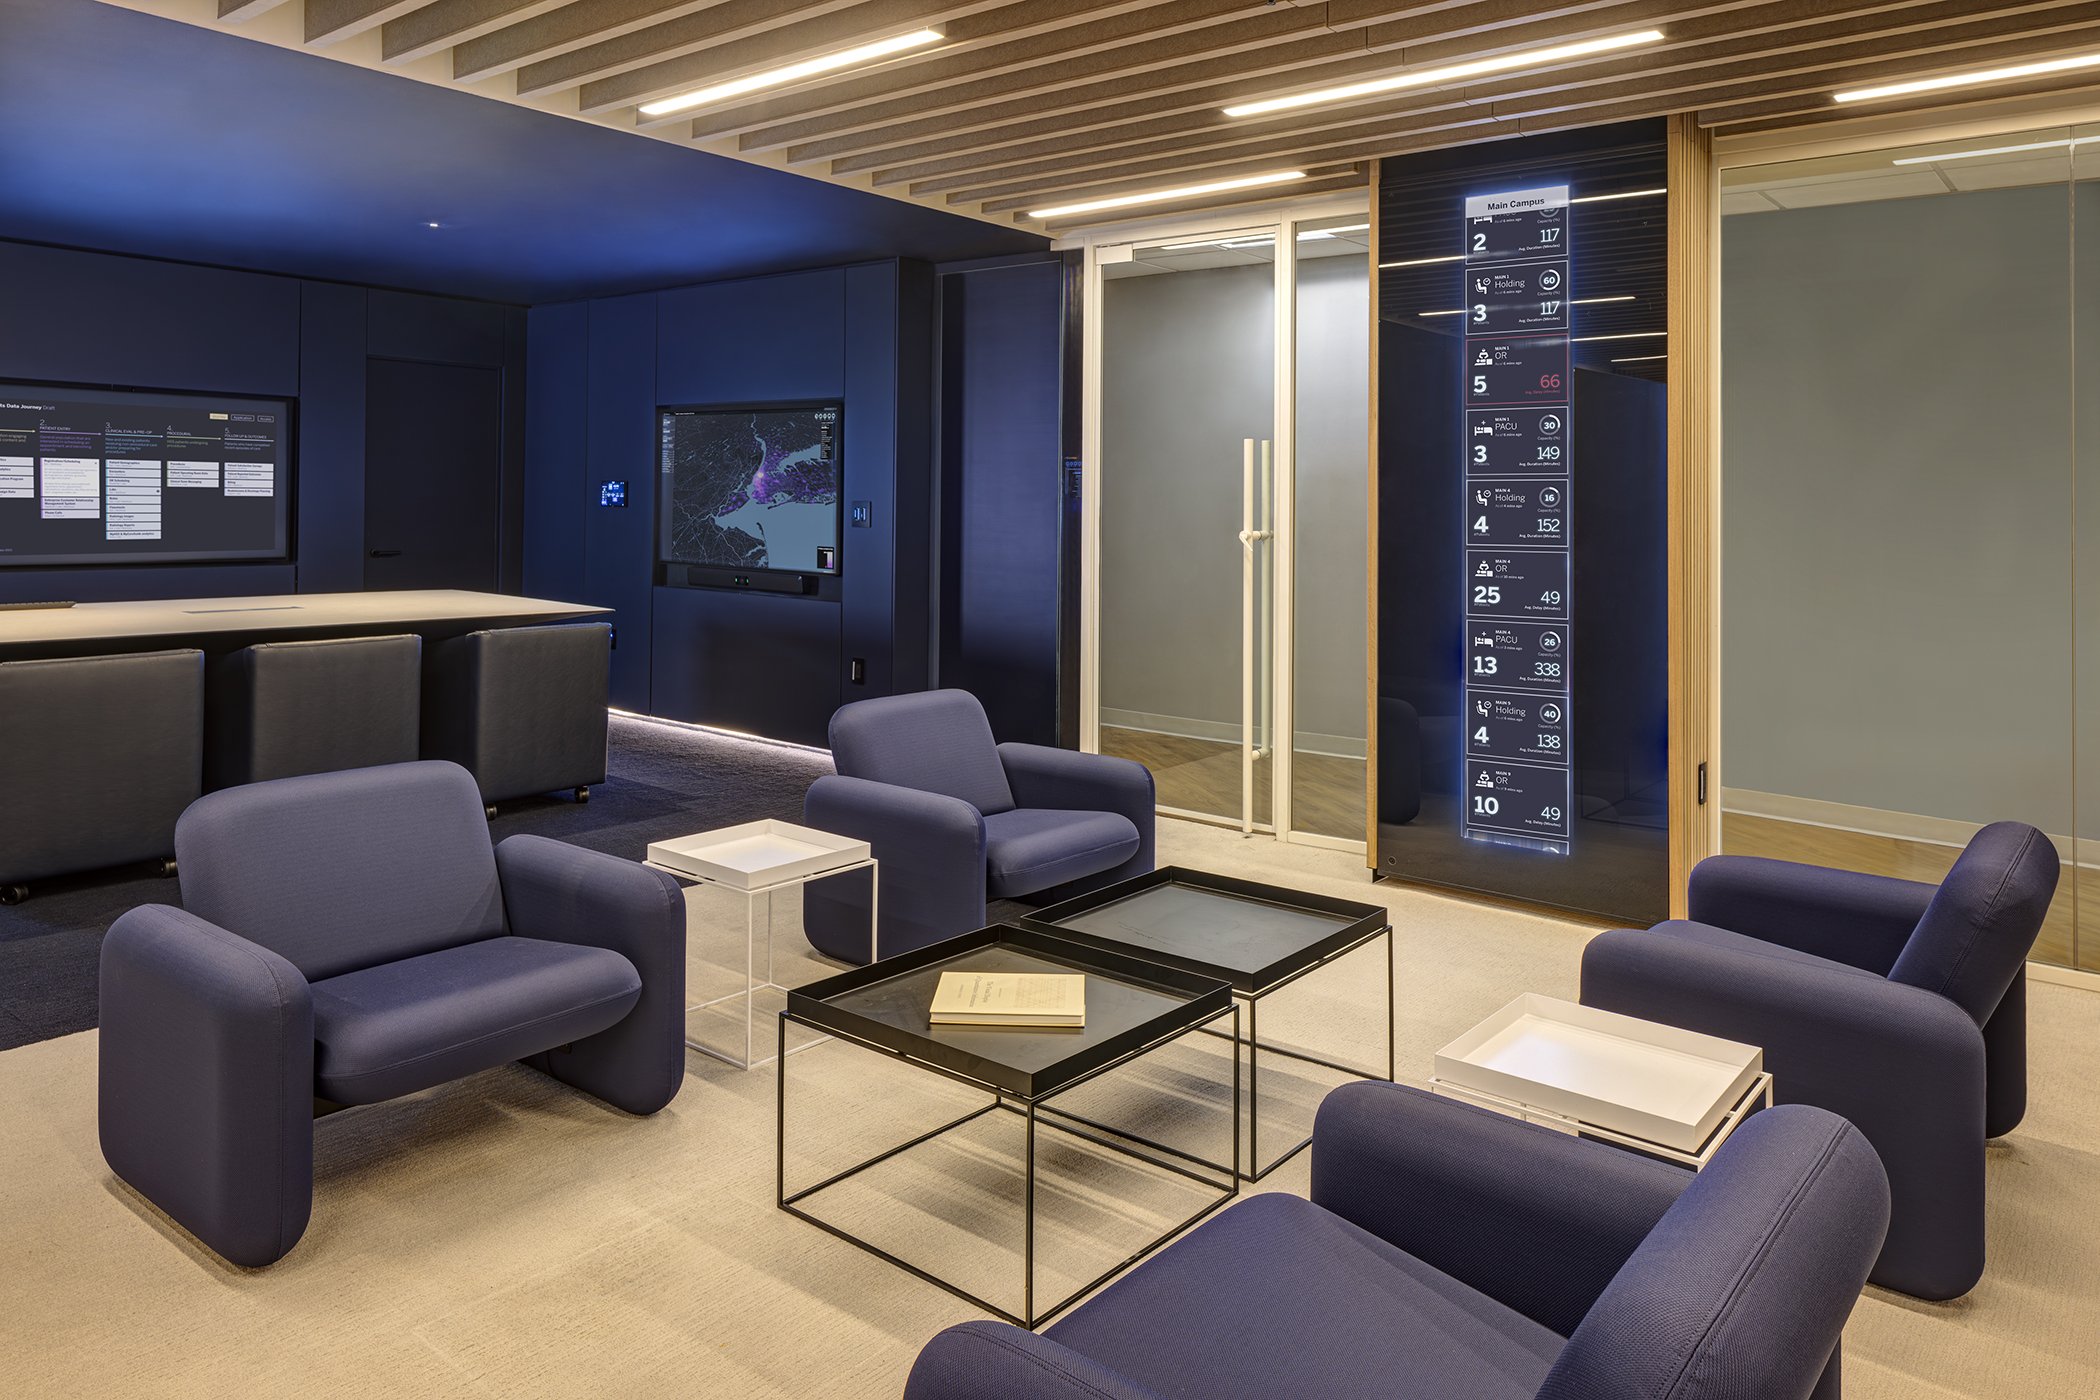
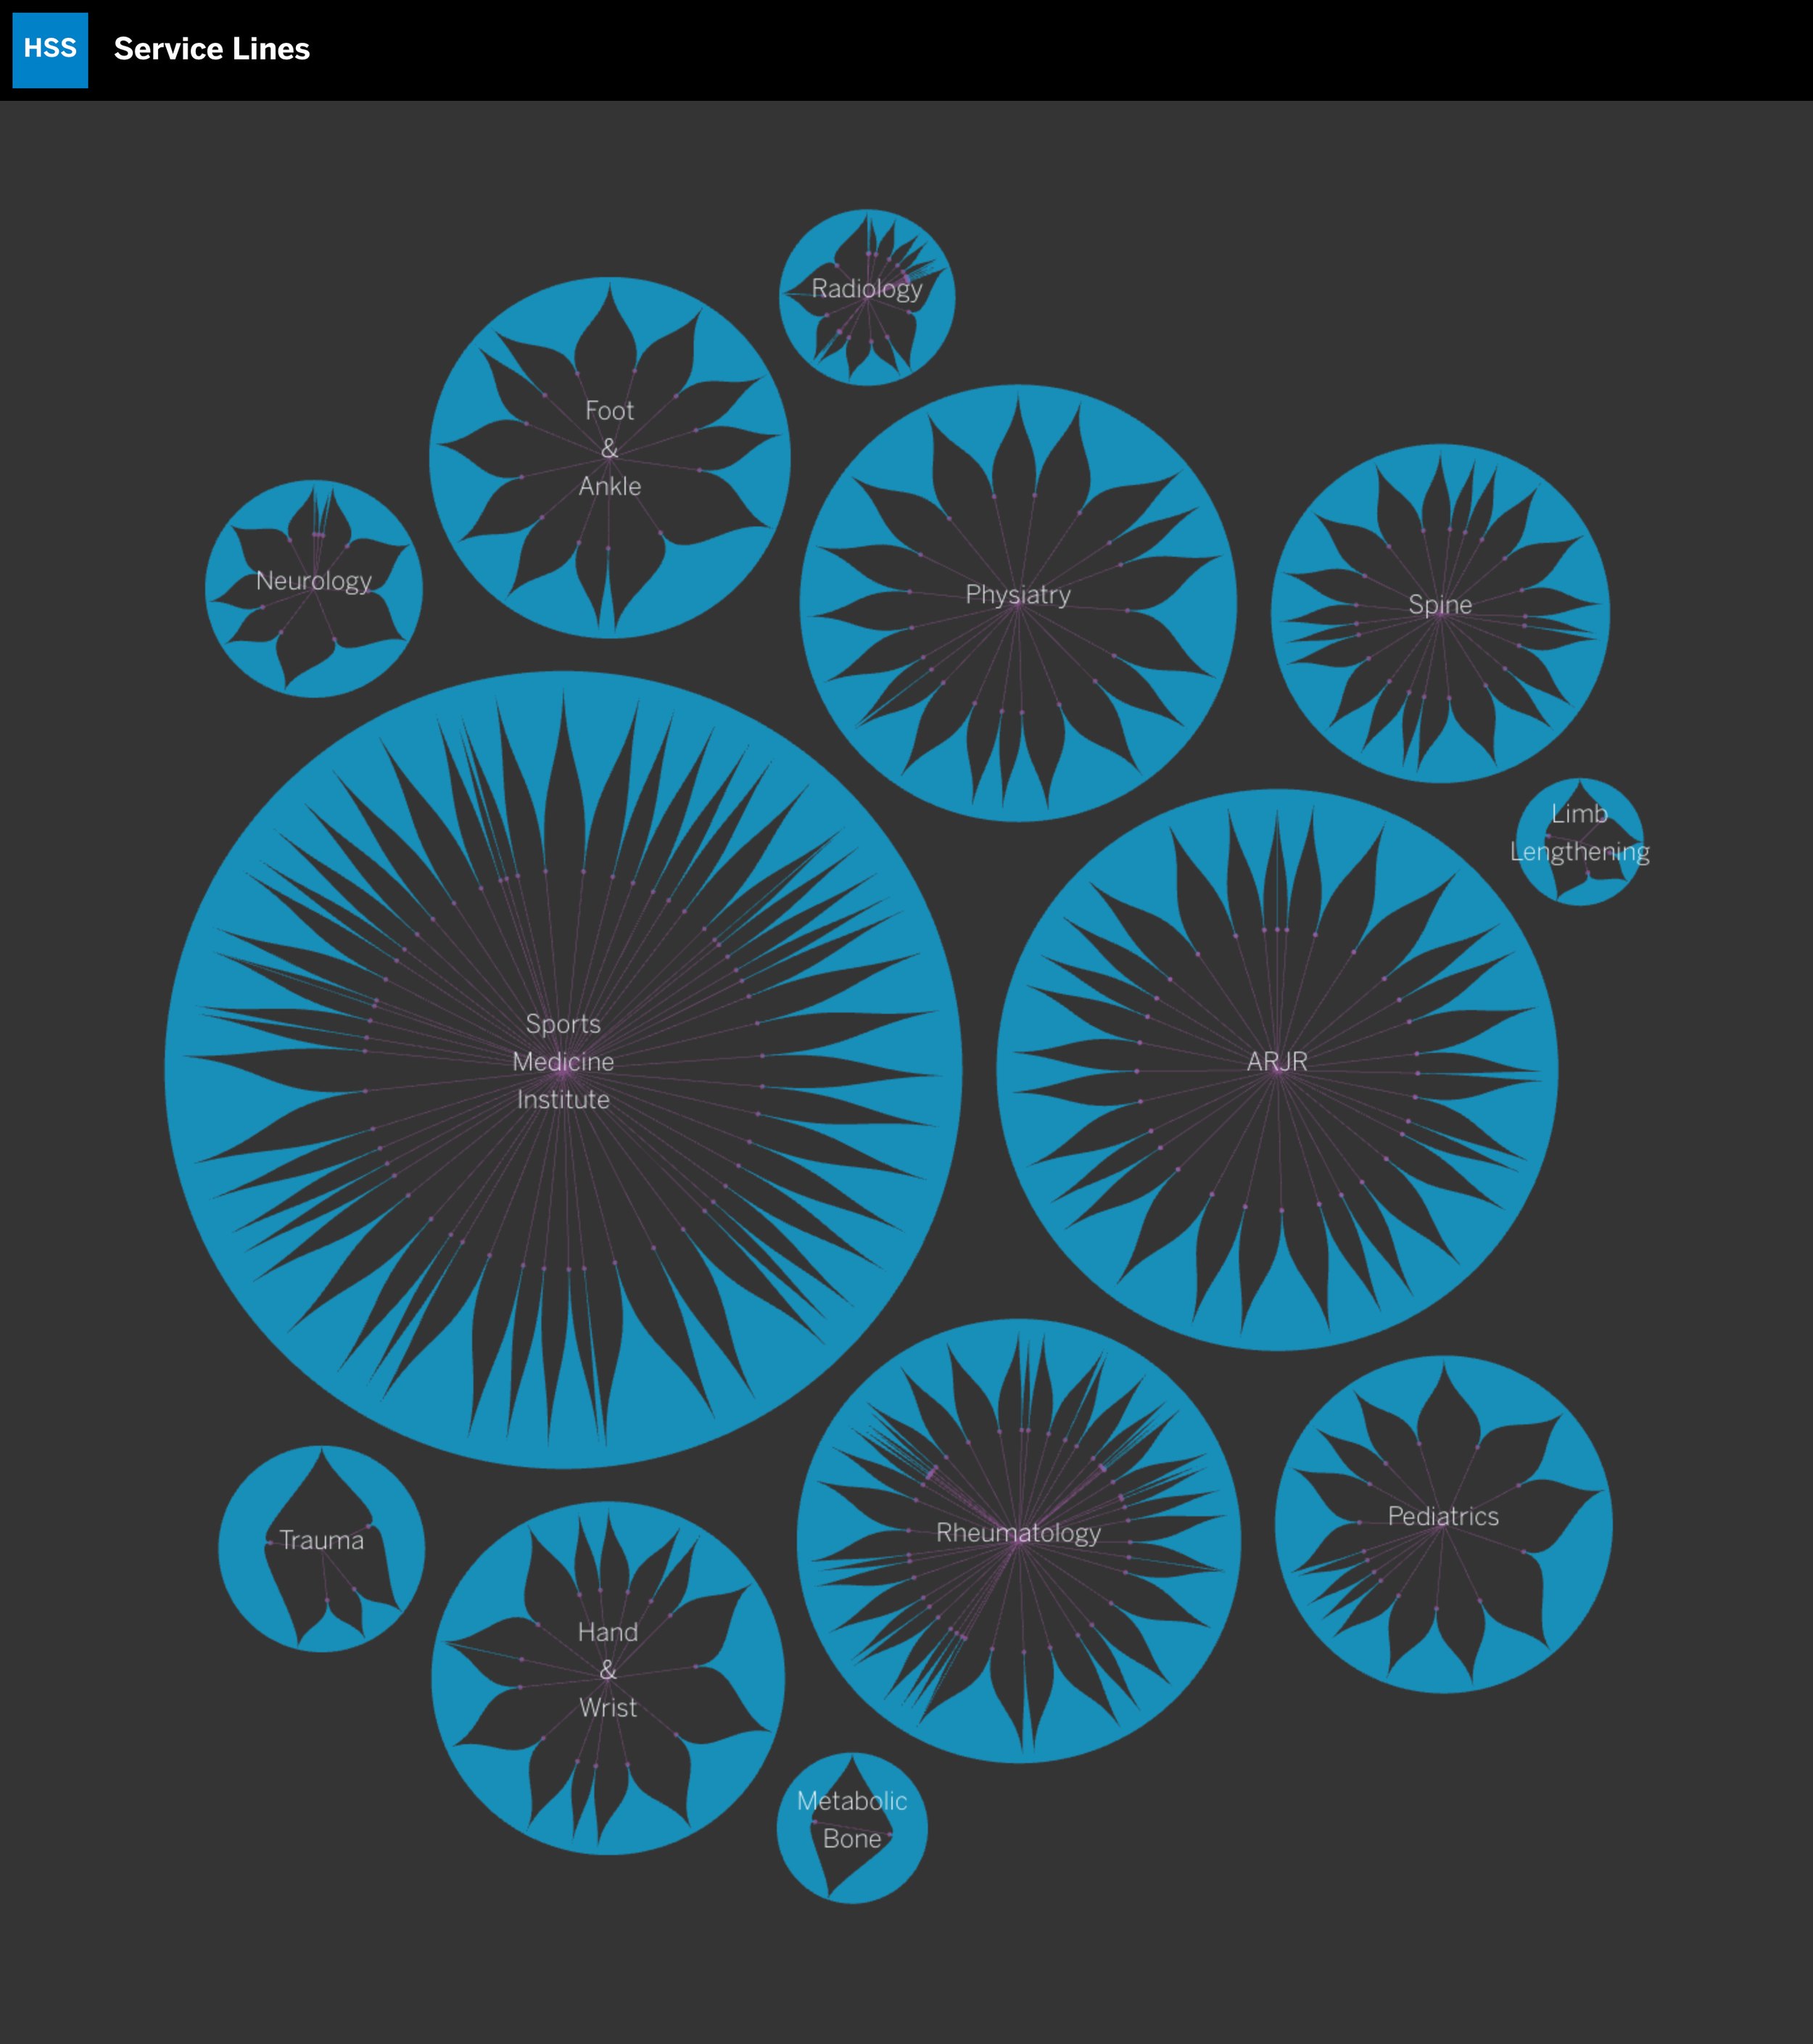


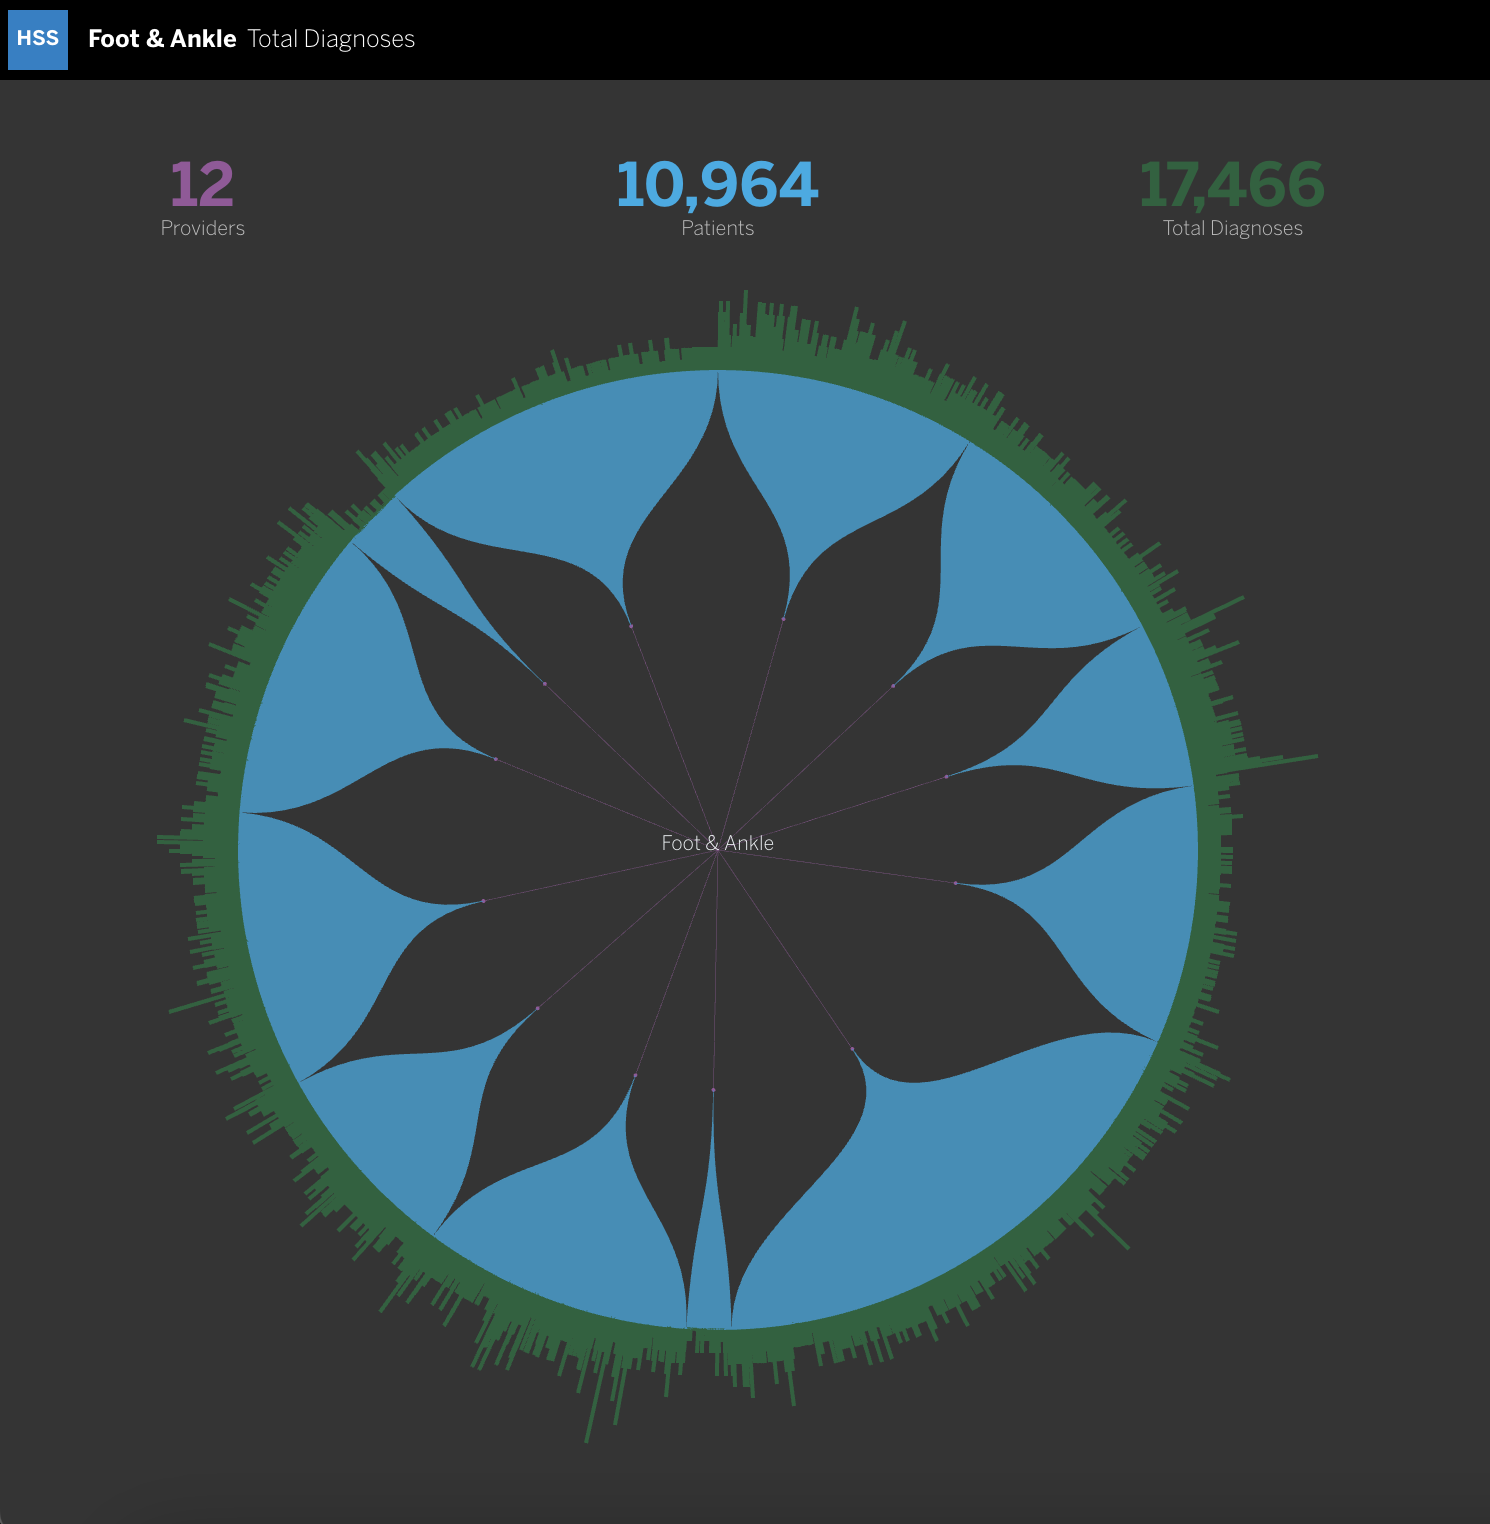
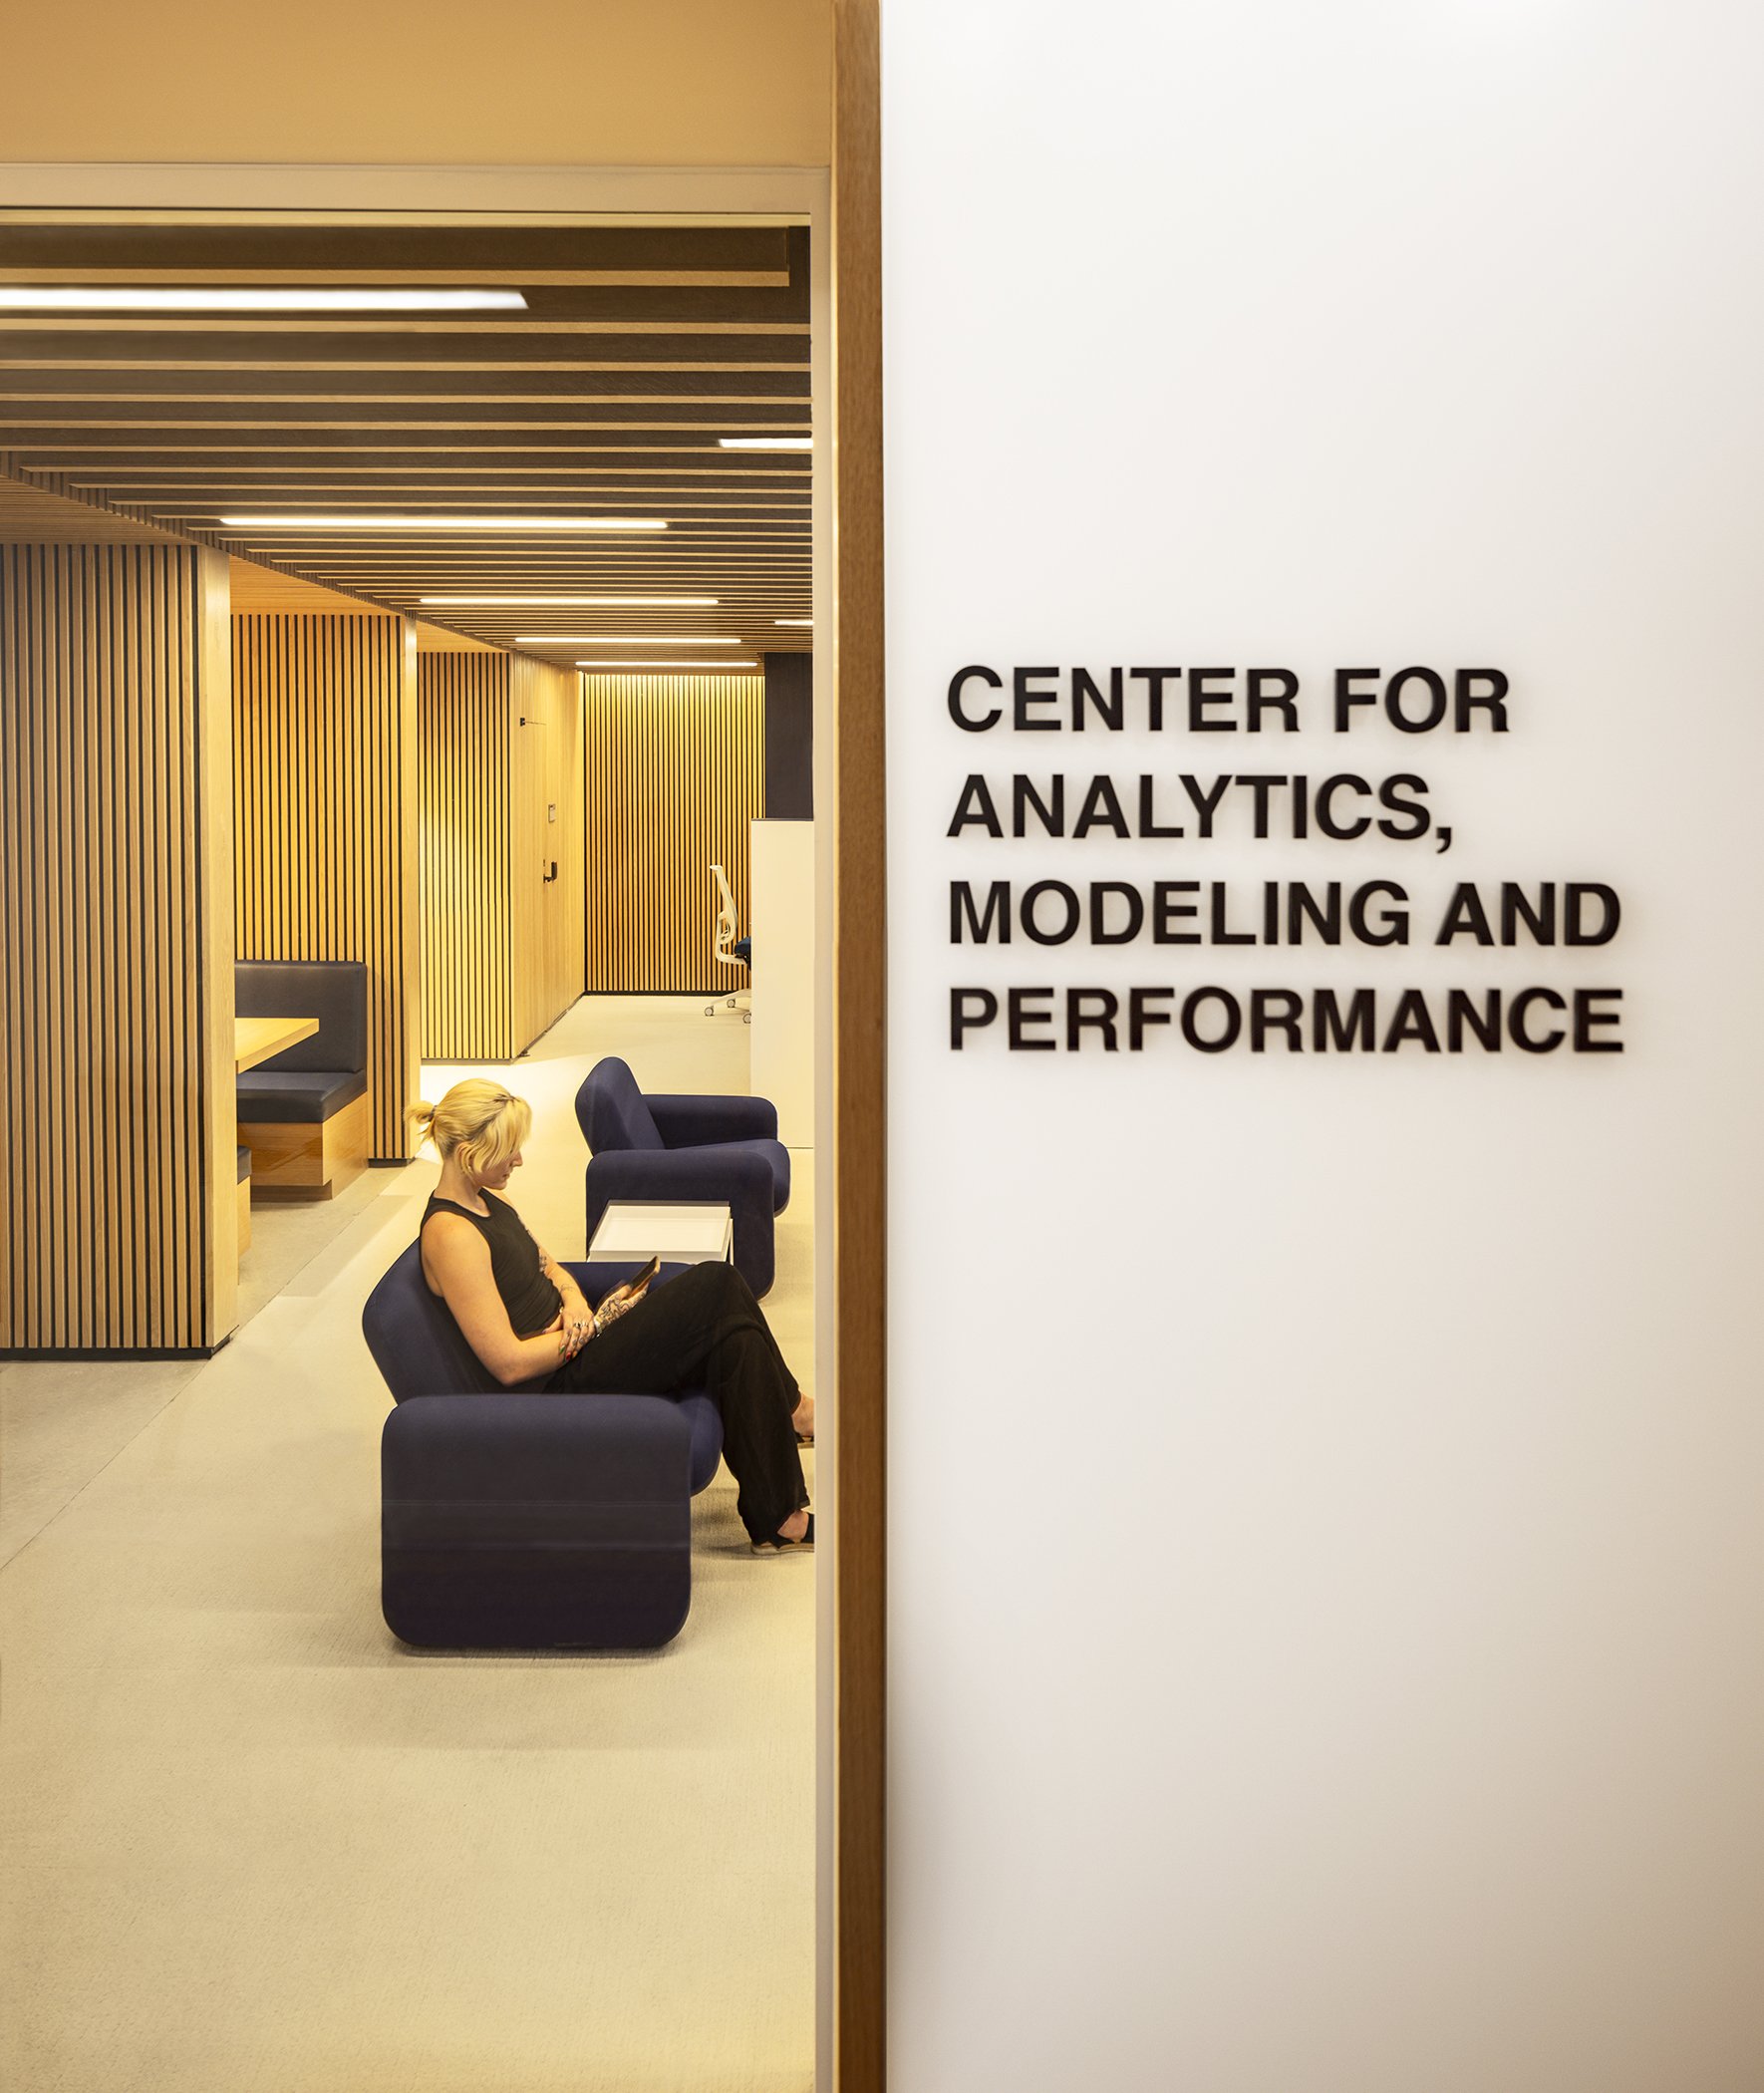
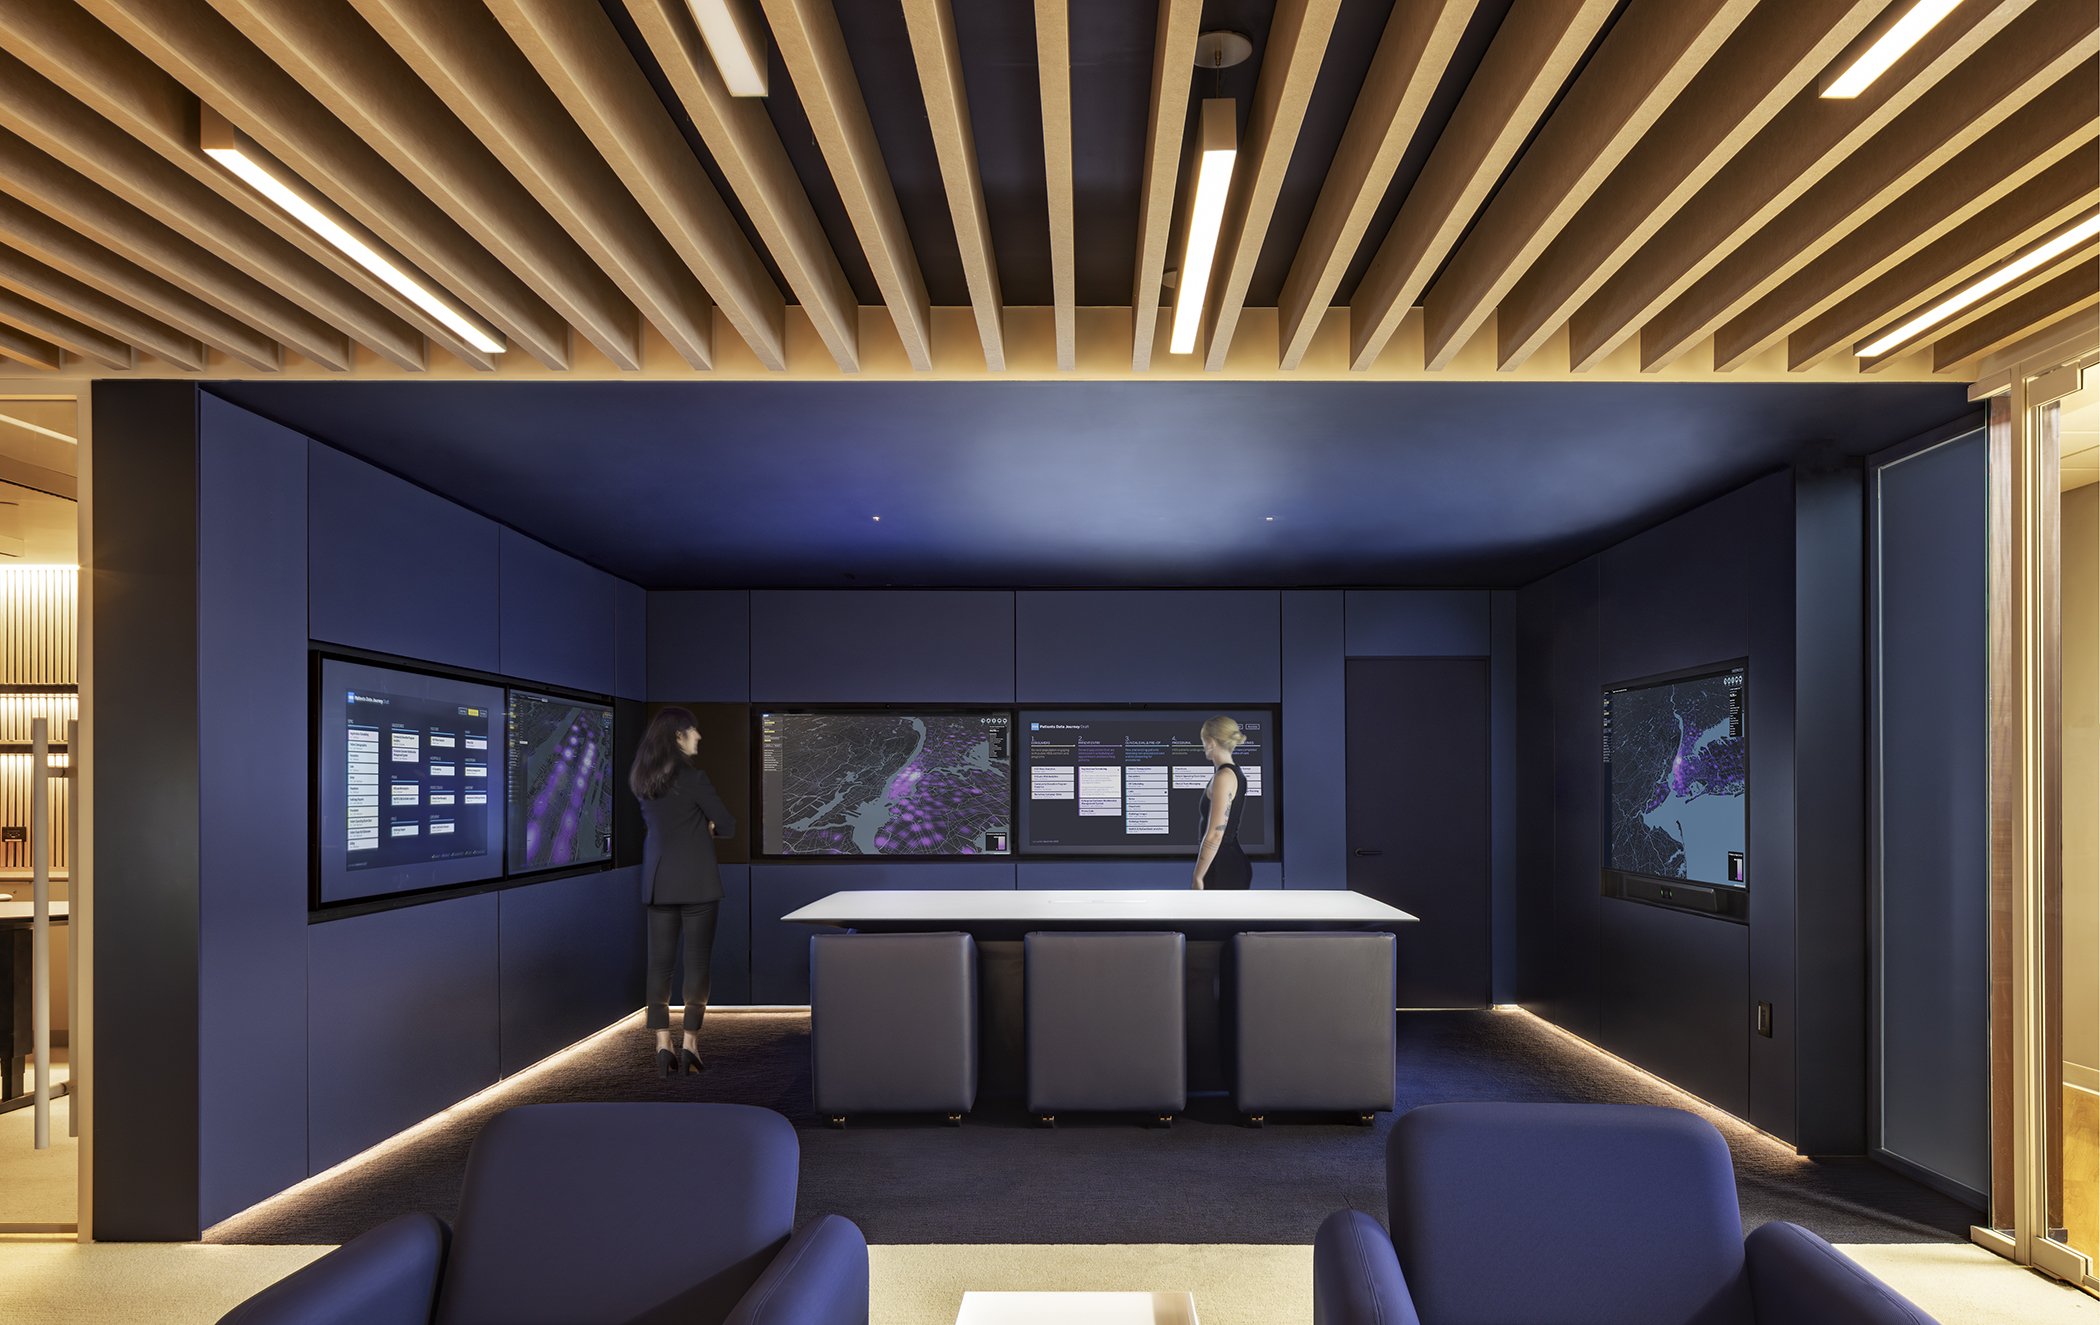

My biggest achievement at TWO-N was working on a project for the Hospital For Special Surgeries (HSS). I was tasked with building three custom data visualizations for their new Center for Analytics, Modeling and Performance (CAMP). These data visualizations would each be displayed on a unique screen; tv-sized touch screens, a floor-to-ceiling stretch screen, and a large LED panel.
The first visualization is a web application with a map component that visualizes volume of patients and visits at different branches of the hospital system. This application was built for large touchscreens in their Data 360 space within CAMP. I built this using React, MapBox, and Deck.gl. Through filtering options based on categories such as service, physician, and time period, and many others, users gain valuable insights into the operational landscape of HSS facilities. I worked closely with their data analysis team, as well as their backend developer to build a product that would be useful and intuitive for their team.
The second visualization is a live ticker which shows the capacity and general status of waiting rooms in their facilities in real-time. This live feed not only provides instant updates on room availability but also offers insights into patient flow, aiding in resource allocation and operational decision-making.
The final visualization is an animation which shows a top-level, abstract view of the hospital services. It visualizes the one to many relationships between services, physicians, patients, and patient data. I used D3.js and Canvas to build this visualization. One of the biggest challenges was working with such a large amount of data. This is situated on a large LED screen outside the center, meant to attract interest and visitors to the space.
It was very rewarding seeing this project from conception to production and getting to take ownership over the software development. It solidified my ability to translate complex data sets into meaningful visualizations that empower users to interact with data, gain insights, and make informed decisions.
Testimonial - James Proctor - Lead Data Visualization Engineer at TWO-N
”I'm James Proctor, a developer specializing in data visualization with more than a decade of experience in the field. As a former manager I'm pleased to offer my strongest recommendation for Parker Kaufmann. Parker was a tremendous asset to my team at TWO-N, and quickly demonstrated herself to be highly motivated, capable of both working collaboratively and solving problems independently.
We worked together directly on a number of projects, including creating custom visualizations installed in the workspace of the Hospital for Special Surgery's Data Analytics and Performance Modeling group. Parker developed multiple web apps with 2D and 3D elements which were deployed across several display types in the space including an LED wall, a signage display, and multiple large touchscreens. She deftly switched contexts as we moved from initial concept creation, to core development, to on-site testing and installation.
Please don't hesitate to reach out if you have any questions. I'm confident Parker would be an asset to your team.”